


High-density ASRS earns its place in a distribution warehouse when storage capacity, not throughput, is the constraint the operation cannot buy its way out of. If the building envelope is fixed, land near the customer is expensive, and the pallet profile is stable enough to live in deep lanes, density should set the design and the automation level should follow. The reverse also holds. Where SKU churn is high, cut-off times are tight, and most pallets move several times a day, a dense layout can quietly become a slow one. The difference between the two cases comes down to a small set of conditions and figures, and both are checkable before any architecture is committed.
What High-Density ASRS Means in a Distribution Warehouse
High-density ASRS is a storage architecture selected to raise pallet positions per cubic metre of building, with automated handling treated as the means rather than the objective. The distinction matters because the two goals pull in different directions. Automation level describes how much of the handling is unmanned and how finely the system is orchestrated. Density describes how much of the building’s volume holds pallets rather than air, aisles and access clearance.
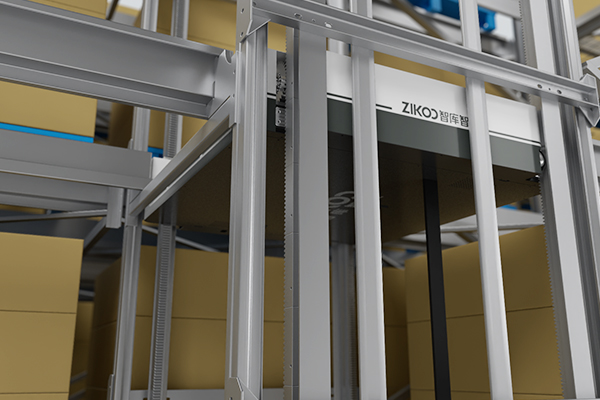
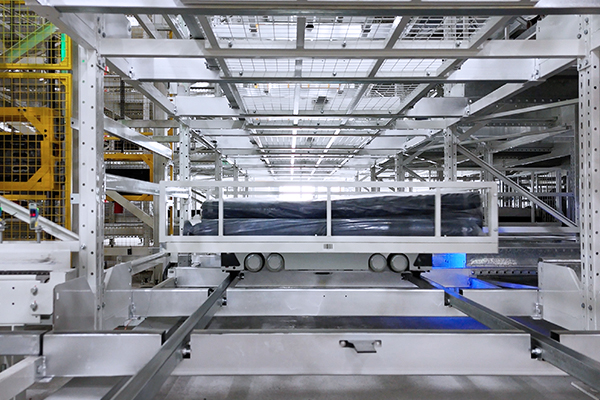
A denser layout usually comes from two moves: taking floor area away from aisles and giving it to rack, and using height that a forklift cannot reach. Shuttle-based systems do both by carrying the pallet inside the rack structure to a transfer point at the rack face, so the vehicle never needs a full aisle to reach a storage position. A crane-based system performs the same vertical work but typically reserves one aisle per crane.
Every dense design has a density ceiling, the point at which each additional position per square metre takes away more throughput or access than it adds storage. Deeper lanes, more levels and fewer transfer points all move a layout toward that ceiling. Past it, positions still exist on the drawing, but the operation cannot reach them at the rate the business needs, so the extra capacity is paid for and not used.
Density is also not the same as sophistication. A high-bay crane warehouse can be heavily automated and only moderately dense. A deep-lane shuttle warehouse can be denser with simpler vehicles and less software. Neither is better in the abstract. The question is which constraint binds first in a specific building with a specific order profile.
Four Conditions That Decide When Density Beats Automation
Density wins when the cost of not having a position is higher than the cost of reaching it more slowly. In practice that happens when four conditions hold together. Three of them can be checked from drawings and data before any supplier is asked for a price.
The Building Envelope Is the Binding Constraint
If the site cannot expand, or expansion costs more per pallet position than the equipment that avoids it, capacity has to come from inside the existing walls. This is the classic distribution warehouse problem: land near customers is expensive, planning permission is slow, and the lease term is often shorter than the payback period of a new building. In that situation the design should be judged on positions per cubic metre first and moves per hour second, because a layout that cannot store the inventory fails regardless of how fast it moves.
The Pallet and SKU Profile Can Live in Deep Lanes
Deep-lane storage trades access for density. Each lane holds several pallets of the same reference, so the system works when the inventory has enough quantity per SKU to fill lanes without leaving gaps. A distribution centre holding a few hundred stable references in large quantities is a natural fit. A centre holding tens of thousands of slow references is not, because the lanes fill with air.
Moves per Position Stay Low
The useful ratio is total pallet moves per day divided by total pallet positions. When that number is low, most pallets sit still and the building is doing its job as a buffer. Density then dominates the economics, and a slower retrieval path costs little because it is rarely used. When the ratio climbs, the same layout becomes a queue, and every extra second of retrieval is multiplied by a large number of moves.
Labour and Safety Costs Sit in the Aisles
Narrow aisles and high rack levels are where forklift labour becomes expensive and where the serious safety exposure lives. Even at moderate throughput, removing people from those aisles can justify automated handling on its own. This condition often decides the case in markets where warehouse labour is scarce, and it can tip a project toward automation at a density level that would otherwise be handled manually.
| Decision driver | Density-first answer | Automation-first answer | Do not choose density-first when |
|---|---|---|---|
| Building envelope | Fixed footprint, capacity from height and aisle reduction | Footprint can expand or relocate | The lease ends before the payback period and relocation is realistic |
| SKU profile | Few hundred stable references in large quantities | Many references with frequent change | Quantity per SKU is too low to fill a lane at any practical depth |
| Moves per position | Low to moderate, predictable windows | High, with tight cut-off times | Most positions turn over several times a day |
| Labour exposure | High cost or high safety risk in aisles | Labour available and aisles already controlled | Manual handling is already safe, cheap and adequate |
| Capital profile | Spend on rack, structure and transfer layer | Spend on vehicles, controls and software | Capital is constrained and phased expansion is already planned |
When Automation Should Lead Instead
When most positions move several times a day, the layout should optimise for access and let density follow. That usually means more aisles, more vehicles, higher vertical speed and a control layer that can sequence missions tightly. A crane-based ASRS with a dedicated aisle per crane can serve this profile well at height. A shuttle system with a large vehicle fleet can serve it at lower height with more flexibility. Capital cost per position rises in both cases and the cost per move falls, which is the correct trade when the move count is high.
Mixed pallet footprints and frequent replenishment also favour access over depth. Every non-standard pallet that cannot enter a deep lane becomes an exception, and exceptions consume the same transfer resources as normal missions. High-value goods add a further reason to keep positions shallow and traceable, because unit level visibility is easier when a pallet does not disappear behind five others.
There is a middle case worth attention: a warehouse where density and throughput both matter, but on different axes. Storage can be dense in the bulk area while the forward pick face stays shallow and fast. Separating those two functions is often more effective than compromising on either one across the whole building.
Crane-based and shuttle-based ASRS solve different constraints, and the choice usually turns on aisle count, height and vehicle count rather than on price alone. <Stacker Crane vs Four-Way Shuttle: Which Fits Your ASRS Warehouse Best> covers how the two architectures compare inside an ASRS warehouse.
The Numbers That Decide It, and What They Do Not Prove
A supplier layout is a screening document, not an acceptance record. It shows geometric feasibility under stated assumptions. It does not show that the rack can be permitted in your jurisdiction, that the vehicle achieves its quoted cycle with your load and your floor, or that system throughput survives your busiest week. Separating what a figure measures from what it is claimed to mean is the difference between a comparable quotation and a set of brochures.
| Comparison point | What is actually measured or verified | What is often a claim or inference | What must not be inferred |
|---|---|---|---|
| Positions per floor area | Counted from an approved layout at your rack height | A brochure figure quoted as “up to” a number | That a brochure figure survives your fire protection and clearance rules |
| Aisle and lane dimensions | Checked against the vehicle envelope, tolerances and pallet overhang | A nominal aisle width quoted without speed or load conditions | That nominal width equals usable width on a real floor |
| Throughput | Built from an agreed mission profile across a full shift | A peak rate measured at ideal cycle time | That a machine’s best cycle adds up to system throughput |
| Vertical transfer capacity | Verified from lift count, speed and acceleration under load | A single lift rate presented as the system rate | That one transfer unit can feed every level of a multi-level layout |
| Code and fire protection | Reviewed with the fire protection engineer and authority having jurisdiction | A general statement that the design meets local codes | That an approval obtained in another country applies here |
| Cost per pallet position | Assembled from a scoped bill of quantities | A single price per position | That the lower figure includes rack, fire protection, building works and software |
Read the table as a set of questions rather than a verdict. Two quotations can only be compared when each line is answered at the same scope. A dense layout that looks cheaper per position frequently becomes the more expensive option once in-rack fire protection, structural reinforcement and software scope are added back in.
Design Choices That Turn Density Into Usable Capacity
Density on a drawing becomes capacity only when rack geometry, the transfer layer and the software agree with each other. Five design choices do most of the work.
Lane depth should follow the inventory distribution, not the deepest lane the rack can physically provide. A lane of six pallets in a warehouse where most references hold two creates four empty positions for every two used. Lane depth is therefore a decision about inventory first and about steel second.
Aisle count sets how many transfer points the building can support. Fewer aisles raise density and concentrate traffic. Each transfer point becomes a shared resource, and shared resources queue at peak. The right number depends on peak simultaneous missions, not on the average day.
The vertical transfer layer decides whether a multi-level layout works. A vertical shuttle that occupies a single storage footprint, rather than reserving a full aisle, converts floor space into rack space directly. Positioning accuracy at the interface matters, because a small misalignment becomes a recurring fault when it repeats thousands of times a shift. A four-way shuttle working with a vertical bidirectional shuttle can reach a six-direction network, which is one way to keep the transfer layer from becoming the bottleneck.
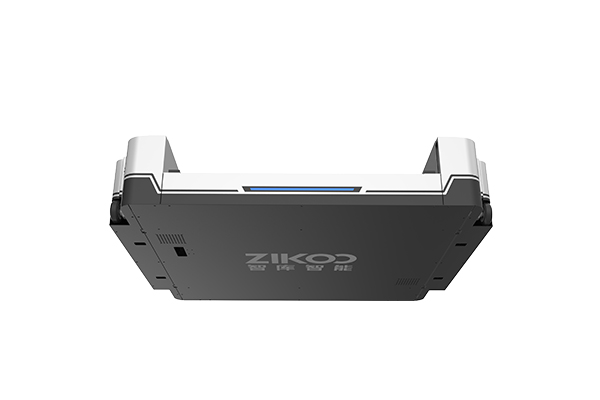
When the vertical move is the bottleneck, horizontal speed buys little. <Six-Way Shuttle: The Dual-Engine Solution for High-Density and High-Throughput> covers how a six-way shuttle network targets density and throughput together.
Vehicle envelope drives what the rack can offer. A thin shuttle body can enter rack levels directly instead of requiring a reserved level for access, and that single dimension changes the usable height of the structure. Load rating and pallet dimensions then bound which pallets can use the dense area at all.
Slotting logic decides whether the physical density is realised over time. Static slotting set at commissioning drifts toward honeycombing as the mix changes. A warehouse control layer that re-slots by velocity and quantity keeps lanes full, and a warehouse execution layer that sequences missions keeps the transfer points from stalling.
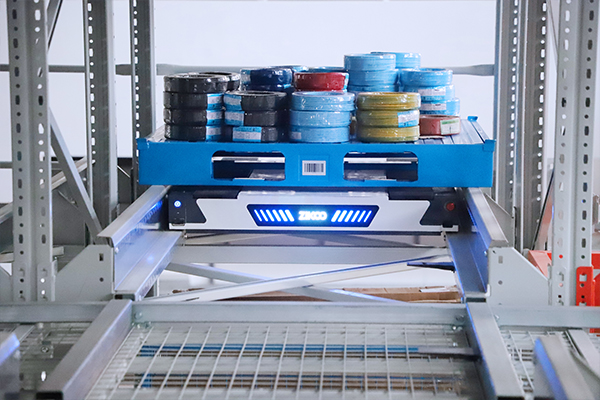
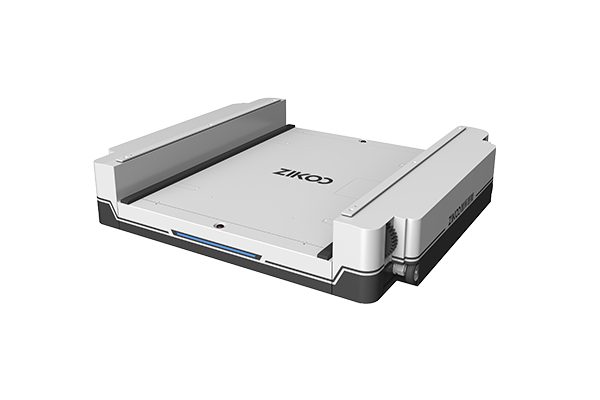
One practical example from our own range shows how these choices interact. Zikoo’s four-way shuttle has a body thickness of 125 mm and a rated load of 1.2 to 1.5 tonnes across standard models, with heavier models rated to 2 tonnes. That envelope is what allows direct level entry in a dense rack. It is a product characteristic, not a claim about your throughput, which still depends on layout, fleet size and mission profile.
Where Density-First Designs Lose Their Advantage
Most density failures are not construction failures. They are drift failures, where a layout that started full becomes progressively emptier as inventory and the order profile move.
The first is honeycombing drift. Deep lanes dedicated to references that shrink in quantity leave unusable gaps that still occupy floor space. The density that justified the investment erodes without any equipment fault, and the operator experiences it as a warehouse that is somehow always short of positions despite being full of rack.
The second is shared-resource dependency. A single vertical transfer unit serving several levels is efficient at design throughput and fragile at peak. Redundancy in the transfer layer costs positions. Omitting it costs service reliability later, and that trade should be made deliberately rather than discovered during a peak week.
The third is fire protection and code scope. In-rack sprinkler protection, smoke venting and clearance rules consume vertical space and can constrain permissible rack height and aisle arrangement. A layout developed before those requirements are confirmed may not be buildable at the density it promises, and the correction usually arrives after the steel is ordered.
The fourth is maintenance access. Mechanisms need reachable service points and a safe way to get to them. A deep structure with a single access path raises mean time to repair, and repair time is throughput lost.
The fifth is scope confusion in pricing. Comparing a price per pallet position across suppliers is misleading when one figure includes rack, fire protection and building works and another covers vehicles and software only.
Cost per pallet position only becomes comparable when building works, rack, fire protection and equipment scope are separated before the numbers are added. <Smart Warehousing Starts Here: Cost-Effective Four-Way Shuttle Systems> covers cost-effective four-way shuttle configurations for this kind of comparison.
How to Prove the Density Case With Your Own Numbers
The decision can be tested before a supplier is chosen. Six steps, run in order, produce a defensible answer.
- Fix the usable envelope. Take the floor area, then subtract dock space, staging, egress routes, charging or maintenance areas and any area the fire protection strategy reserves. The remainder is the only area that can carry rack.
- Count positions from an approved layout at your real clear height, not from a brochure. Include the top level only if the transfer equipment can actually serve it.
- Calculate aisle and lane share. Positions per square metre is the headline number, but aisle share is what you negotiate with the layout, and it moves faster than any other variable.
- Estimate honeycombing. For full-lane dedication, required positions approximately equal active SKUs multiplied by lane depth. Divide that by available positions. If the result approaches one, the layout has no room for mix change and lane depth should reduce.
- Convert throughput into moves per position. Total pallet moves per day divided by total positions. This single ratio tells you whether you are designing a buffer or a transfer machine, and it should drive the architecture more than any other input.
- Price three scopes separately: building and structure, rack and fire protection, equipment and software. Compare each scope line by line. Only then does a per-position figure mean anything.
If the ratio in step five is low and the honeycombing estimate in step four leaves headroom, density should lead and the automation level should be sized to the transfer layer. If either test fails, the same building may still be automated, but the layout should optimise access and accept a lower position count. Reviewing reference installations at a comparable scale is a reasonable final check, provided the reference is assessed on its own operating conditions rather than on the vendor’s description of it.
Send the Layout Before You Choose the Machines
A density decision is checkable in a week if the inputs are organised. Send us the building footprint and clear height, the pallet footprints and load heights you actually handle, the number of active SKUs and the quantity held per SKU, the total pallet moves per day, the shift pattern, and whatever you already know about fire protection and rack height limits. Note whether the building is new or already in operation, because that changes the phasing options considerably.
With those inputs, the density case can be tested against the throughput case on your own figures rather than on a template. You can reach the team at info@zikoo-int.com or on (+86)-19941778955. Zikoo Smart Technology Co., Ltd builds pallet-to-person systems including four-way shuttles, omnidirectional stacker robots, vertical bidirectional shuttles and the PTP warehouse software layer, and can review a layout against those inputs. The review establishes feasibility under stated assumptions, not a guaranteed throughput or a permitted design; those still depend on your site, your authority having jurisdiction and your operating profile.
FAQ
Is high-density ASRS the same thing as a four-way shuttle system?
No. High-density ASRS describes a design objective, which is maximising usable positions per cubic metre. A four-way shuttle is one technology that can serve that objective. A crane-based high-bay system, a satellite shuttle on a simpler rail, or a vertical shuttle feeding a dense rack can all be part of a high-density design. The label describes what the layout achieves, while the vehicle type describes how it is achieved, and the two should be evaluated separately.
How do I tell whether density or throughput is my real constraint?
Divide total pallet moves per day by total pallet positions. A low result means most pallets sit still and the building is a buffer, so capacity governs. A high result means the same pallet is retrieved repeatedly and access governs. Then check whether expansion is physically and economically possible. If it is not, density is your constraint regardless of the ratio, and the design should find capacity inside the existing envelope.
Does a denser warehouse always cost less to run?
No. Denser layouts reduce building, land and often labour cost per position, but they can raise the cost of each retrieval, concentrate dependency on shared transfer equipment, and add fire protection scope. Operating cost depends on how many moves the system performs and how well slotting keeps lanes full. A dense layout used as a buffer is usually cheaper to run; the same layout used as a fast-turnover picking store usually is not.
Can a dense ASRS be retrofitted into an existing distribution warehouse?
Often yes, with conditions. The floor must carry the rack and vehicle loads, the clear height must support enough levels to justify the investment, and the fire protection strategy must be reworked for the new storage configuration. Phasing matters more than in a new build because operations continue during installation. A retrofit usually works best when the dense area is added alongside the existing operation rather than replacing it in one step.
What should I measure after go-live to check the density decision?
Track positions actually used against positions installed, lane fill rate by SKU, moves per position, and utilisation of the transfer layer at peak. Those four figures show whether the density is being realised or drifting into honeycombing. If installed positions stay heavily used while peak queue time at transfer points rises, the constraint has moved to the transfer layer, and redundancy there is the next investment rather than more rack.
If you’re interested, check out these related articles:
Smart Storage Revolution: Comprehensive Overview of Four-Way Shuttle Systems for Automatic 3D Warehouses
PTP Intelligent Warehouse Software Empowers Enterprises for Smart Upgrades


